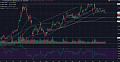
Nifty is sitting on multi-year resistance. Major rejection is likely in line with a deflationary crash likely to play out in the next few years. Major support at 9500:

Ahead of the Curve provides you with analysis and insight into today's global financial markets. The latest news and views from global stock, bond, commodity and FOREX markets are discussed.
Featured post
Time Series Analysis with GRETL
This video shows key time-series analyses techniques such as ARIMA, Granger Causality, Co-integration, and VECM performed via GRETL. Key dia...

Showing posts with label india stock market. Show all posts
Showing posts with label india stock market. Show all posts
Tuesday 17 November 2020
Sunday 16 August 2020
Market Signals for the US stock market S and P 500 Index and Indian Stock Market Nifty Index for the Week beginning August 17
|
Indicator |
Weekly
Level / Change |
Implication
for S
& P 500 |
Implication
for Nifty* |
|
S
& P 500 |
3373, 0.64% |
Bullish |
Bullish |
|
Nifty |
11178,
-0.32% |
Neutral
** |
Neutral |
|
China
Shanghai Index |
3360, 0.18% |
Neutral |
Neutral |
|
Gold |
1954, -3.67% |
Bearish |
Bearish |
|
WTIC Crude |
42.23,
2.45% |
Bullish |
Bullish |
|
Copper |
2.86, 2.52% |
Bullish |
Bullish |
|
Baltic
Dry Index |
1577, 5.06% |
Bullish |
Bullish |
|
Euro |
1.1843,
0.47% |
Neutral |
Neutral |
|
Dollar/Yen |
106.60,
0.63% |
Bullish |
Bullish |
|
Dow
Transports |
10960,
3.62% |
Bullish |
Bullish |
|
High
Yield (Bond ETF) |
104.38,
-1.42% |
Bearish |
Bearish |
|
US 10
year Bond Yield |
0.71%,
25.33% |
Bearish |
Bearish |
|
Nyse
Summation Index |
921, 15.51% |
Bullish |
Bullish |
|
US Vix |
22.05,
-0.72% |
Bullish |
Bullish |
|
Skew |
137 |
Neutral |
Neutral |
|
20
DMA, S and P 500 |
3296, Above |
Bullish |
Neutral |
|
50
DMA, S and P 500 |
3199, Above |
Bullish |
Neutral |
|
200
DMA, S and P 500 |
3065, Above |
Bullish |
Neutral |
|
20
DMA, Nifty |
11171,
Above |
Neutral |
Bullish |
|
50
DMA, Nifty |
10701,
Above |
Neutral |
Bullish |
|
200
DMA, Nifty |
10842,
Above |
Neutral |
Bullish |
|
S
& P 500 P/E |
28.99 |
Bearish |
Neutral |
|
Nifty
P/E |
31.09 |
Neutral |
Bearish |
|
India
Vix |
21.67,
-4.01% |
Neutral |
Bullish |
|
Dollar/Rupee |
74.90,
-0.16% |
Neutral |
Neutral |
|
Overall |
S
& P 500 |
Nifty |
|
|
Bullish
Indications |
11 |
12 |
|
|
Bearish
Indications |
4 |
4 |
|
|
Outlook |
Bullish |
Bullish |
|
|
Observation |
The S
and P was up and the Nifty fell last week. Indicators are bullish for the
week. The
markets have begun a great depression
style collapse. Watch those stops. |
||
|
On the
Horizon |
Euro Zone
– CPI, UK CPI, Japan – GDP, China – PBOC rate decision |
||
|
*Nifty |
India’s
Benchmark Stock Market Index |
||
|
Raw
Data |
Courtesy
Stock charts, investing.com, multpl.com, NSE |
||
|
**Neutral |
Changes
less than 0.5% are considered neutral |

The S and P 500 rallied and the Nifty fell last week. Indicators are bullish for the coming week. The recent rally to the prior highs is on borrowed time as we experience one of the worst earnings decline period in stock market history with extremely high valuations amid a lot of bearish divergences. We rallied 46% right after the great depressions (1930’s) first collapse and we have rallied over 50% in our most recent rally of the lows in a similar 6 month period. After extreme euphoria for the indices a highly probable selloff to the 2700 area is emerging on the S and P, and 9000 should arrive on the Nifty in short order. The FED is repeating the Japan experiment and the lost 3 decades in Japan (1989-2019) is set to repeat across the globe. SPX 1500 and lower by year end and we stay there till 2050, scary? The markets are very close to an epic melt down and the SPX is headed way lower. The markets are overvalued, overbought and out of touch with economic realities. Long term, the epic meltdown is set to continue resulting in a 5 year plus bear market with lot lower levels maybe as low as 800 on the S and P. QE forever from the FED is about to trigger the deflationary collapse of the century and we have made a major top in global equity markets. The market is looking like the short of a life time with non-conformations from the transports, other global indices and commodities. High valuations continue. The breakdown in Crude and the Euro is a precursor to yet another massive drop in the S and P 500. The recent global virus epidemic (black swan) is likely to dent global GDP significantly and usher in a depression much faster than most think. The trend has changed from bullish to bearish and the markets are getting smashed by a strong dollar. Looking for significant under performance in the Nifty going forward on rapidly deteriorating macros. A 5 year deflationary wave has started in key asset classes like the Euro, stocks and commodities amidst a number of bearish divergences and over stretched valuations. We are entering a multi-year great depression. The markets are still trading well over 3 standard deviations above their long term averages from which corrections usually result. Tail risk has been very high off late as the yield curve inverts into a recession. The critical levels to watch for the week are 3385 (up) and 3360 (down) on the S & P 500 and 11250 (up) and 11100 (down) on the Nifty. A significant breach of the above levels could trigger the next big move in the above markets. You can check out last week’s report for a comparison. Love your thoughts and feedback.
Monday 19 September 2016
Massive M top in Nifty completing and targeting 6000
Check out this chart on the Nifty from StockCharts.com. A massive M top has completed on the Nifty that targets 6000 long term. This incidentally coincides with a trailing P/E of over 24 which is suggestive of over valuation. Note the recent exhaustion candle much like in March 2015 from which the market fell 25%.

Thursday 28 January 2016
Interesting Market News and Views from Global Financial Markets-14

Narendra Modi swept to election victory on a pro-business economic platform on May 16 2014, pushing India’s benchmark Sensex share index to a record high of more than 24,000 points.
The two-day Fed monetary policy meeting that ended on Wednesday was unlikely to stoke much volatility to the greenback, as it wasn’t followed by a press conference as usual.

With global markets experiencing wild swings in 2016, investors want to know how to invest in stocks. Here's our complete guide on how to invest now.
4) Stock Market On Verge Of Crash
The developing cyclical downtrend in the stock market is on the verge of accelerating into a crash.
There are two established ways of killing forward momentum and induce economic recession. One is to sharply reverse monetary policy or margin maintenance policy from very loose to very tight.
Book notes: Meb Faber’s Investing With the House: Hacking the Top Hedge Funds is a good introduction to hedge fund cloning.
Subscribe to:
Posts (Atom)
Market Insight
-
-
Wildfires Contributing To U.S. Air Pollution Levels, Study Finds - Extreme heat and wildfires are contributing to unprecedented levels of air pollution in the United States, according to the American Lung Association study.53 minutes ago
-
Q4 2024 EPS Estimates for First Horizon Co. (NYSE:FHN) Lifted by Analyst - First Horizon Co. (NYSE:FHN – Free Report) – Equities researchers at Wedbush boosted their Q4 2024 earnings per share estimates for First Horizon in a repo...1 hour ago
-
Kim Jong Un's Sister Pledges To Build North Korea's 'Overwhelming' Military Power Amid Rising Regional Tensions - This announcement comes on the heels of a series of events that have escalated tensions in the region. read more2 hours ago
-
Cities' "Doom Loops" Are Even Worse Than You Imagined - *This is why those who understand these dynamics are getting out, even though the city was their home. * *A correspondent who prefers to remain anonymous ...4 hours ago
-
The World’s Most Censored Democracy - ?#Breaking A bishop and several worshippers have been attacked in another mass stabbing in Wakeley, Sydney Australia https://t.co/U1TMjIXqKE — Javeria Sult...4 hours ago
-
-
S&P 500 PE Ratio - *Current S&P 500 PE Ratio:* 27.52 +0.33 (1.20%) 4:00 PM EDT, Tue Apr 2312 hours ago
-
Three Stocks: GE Aerospace, Spotify, and HashiCorp - Three Stocks: GE Aerospace, Spotify, and HashiCorp GE Aerospace The combination of a positive earnings surprise and technical support have shares of GE Ae...12 hours ago
-
Tuesday links: raw materials for LLMs - Geopolitics - A look at how geopolitical events affect the stock market. (carsongroup.com) - Why we fear doing nothing during a geopolitical cr...14 hours ago
-
Transcript: Ashish Shah, CIO GSAM - The transcript from this week’s, MiB: Ashish Shah, CIO, Public Investing, Goldman Sachs Asset Management, is below. You can stream and download our...19 hours ago
-
Next Gen Stock Market Profit Strategies for 2024 - Mike Carr has a breakthrough profit strategy that is going to make your 2024 soar. Find out how this strategy can save you hours of research. The post Ne...
 22 hours ago
 -
Daily Market Brief - Subscriber content. To subscribe to the Daily Market Brief please visit Market Services on NorthmanTrader.com. The Daily Market Brief is an in-depth market...22 hours ago
-
Debt Rattle April 23 2024 - Gustav Klimt The Park 1909 • Alina Habba Rages As Judge Approves Trump’s $175 Million Bond (ET) • Will Trump Testify? (Victoria Taft) • Trump Urges “Pe...23 hours ago
-
State revenue from death and gift taxes : One of these things is not so certain anymore - Estate taxes are commonly called “death taxes” because they’re levied on the value of everything you own at the time of death. Only estates valued above a ...1 day ago
-
Billions of cicadas are about to emerge from underground in a rare double-brood convergence – Cooley & Simon - Billions of cicadas are about to emerge from underground in a rare double-brood convergence Cicadas climb up a tree at the U.S. Capitol in Washington, D.C....2 days ago
-
“Weekend At Bernie’s Economy”: Joe Biden, Seeking Another Term, Wheels Out The Corpse Of The U.S. Economy - When I was a kid, “Weekend at Bernie’s” was one of my all-time favorite movies. In that film, two guys worked really hard to convince everyone that thei...2 days ago
-
Long Awaited - Weekly report covering Gold, Equities, Crude, Dollar. A look at trade opportunities and covering the model portfolio. The post Long Awaited appeared firs...3 days ago
-
Total Number of Stocks Is Shrinking - [image: total number of nyse nasdaq issues traded] The major averages may still be trending higher, but the total numbers of issues traded on the NYSE an...5 days ago
-
S&P 500 Yearly & Quarterly Pivot Levels | April - June 2024 - First week of January breached Yearly Mid Resistance Level 1 (YMR1) at 4,781 to the upside. March consolidated above Yearly Resistance Level 1 (YR1). April...
 5 days ago
 -
How Investors Can Seize Opportunities in NVDA Amid Market Volatility - According to Todd Gordon, the founder of Inside Edge Capital, NVIDIA Corporation (NVDA) is a strong buy despite a recent pullback. The chart analyst also s...5 days ago
-
Unveiling the Golden Opportunity: Maximizing Profits with GLD - Are you ready to seize the golden opportunity in trading? In our last analysis, we forecasted a monumental breakout in the gold market, and the results h...1 week ago
-
Get More Out of Your Trades: Dukascopy Bank SA Cuts Withdrawal Fees - Dukascopy Bank SA would like to announce the reduction of withdrawal transfer fees on trading products, as follows: *Old fees* *New reduced fees* 3.5 EUR...3 weeks ago
-
Weekend Update - Trendline rejection (3/8/24) - SPX was rejected by the blue trendline Friday. The trendline had been sucessfully tested four times and held since November, until now. SPX has unable ...
 1 month ago
 -
Catastrophic Risk: Investing and Business Implications - In the context of valuing companies, and sharing those valuations, I do get suggestions from readers on companies that I should value next. While I d...
 2 months ago
 -
Hello world! - Welcome to WordPress. This is your first post. Edit or delete it, then start writing!2 months ago
-
Teaching Johns Hopkins A Privilege Lesson - by Not Sure01/12/24Johns Hopkins Hospital Chief Diversity Officer Sherita Hill Golden sent a letter out essentially implying that all people who don’t look...3 months ago
-
Mungerisms: Timeless Wisdom from Charlie Munger on Life and Business - "Mungerisms" are succinct expressions of wisdom and insights coined by Charlie Munger, the Vice Chairman of Berkshire Hathaway and Warren Buffett's longtim...4 months ago
-
If You Find Deer or Elk Antlers on the Ground, Leave Them There, Say Some States - Even though elk do shed their antlers naturally, collecting them brings up a number of ethical issues.6 months ago
-
It’s Crunch Time for The Daily Doom and Doom Time for The Great Recession Blog - The Great Recession Blog is officially done for good, and it remains to be seen if all my writing continues on TheDailyDoom.com. If my writing on economi...9 months ago
-
Innovative Industrial Properties Stock a Great Way to Play Pot Sector - *IIPR Stock Represents a Long-Term Opportunity* Marijuana stocks briefly attracted investors' attention following the 2022 mid-term elections, when Maryl...1 year ago
-
2008 analogue - The 2008 analogue tape looks very interesting from where we stand. Let's anchor it to the next two Fed meetings -- since that's all that matters -- and i...
 1 year ago
 -
Back to trade with Bar Replay - It is often said that one should not be sad about the past, but sometimes it can be nice to return to it. Who would like to buy Tesla for $1 and experience...1 year ago
-
After This Holiday Rally, You Better Know When To Walk Away - This week’s investor insight will make you think twice about the current stock and bond rally as we head into the end of the year. We get a lot of questi...1 year ago
-
How Africa Can Escape Chronic Food Insecurity Amid Climate Change - The toll of extreme weather events on crops underscores the region’s challenges and need for policies to save lives and protect livelihoods.1 year ago
-
12 Bear Market Rules To Live By – Survive & Thrive In The Next Bear Market - 12 Bear Market Rules To Live By – Survive & Thrive In The Next Bear Market [image: Bear Market Rules Survival Guide] I grew up in the 1970s-1980s when th...1 year ago
-
Growth Companies – Getting What You Want - What do the growth companies in your field have in common? How are they doing so well and what can you learn from them? Growth companies usually make a pro...1 year ago
-
-
Blog Post Title - What goes into a blog post? Helpful, industry-specific content that: 1) gives readers a useful takeaway, and 2) shows you’re an industry expert. Use your c...2 years ago
-
Foot Locker Crushed Q2 Earnings Expectations Sending Stock Higher - Plus, AstraZeneca said its antibody therapy reduced the risk of developing COVID-19 symptoms by 77%, The Topps Co’s SPAC merger is off, and Elon Musk annou...2 years ago
-
Elliott Wave Stock Market Update - July 10th - The market has continued its rally to higher highs and it doesn't seem like it wants to stop. We now have a new ATH at 4371 which are NASDAQ levels s...
 2 years ago
 -
The Psychology of QE is Far More Important Than the Amount of It - Let's discuss what QE really does vs the psychology of QE.2 years ago
-
Hello world! - Welcome to WordPress. This is your first post. Edit or delete it, then start writing!3 years ago
-
Trading: Opportunities Are Dispersed - Opportunities are dispersed. You might have an... *READ THE REST OF THE ARTICLE ON THE NEW WEBSITE: JIM ROGERS TALKS MARKETS * *Jim Rogers is a legendary i...
 3 years ago
 -
Market Signals for the US stock market S and P 500 Index and Indian Stock Market Nifty Index for the Week beginning November 09 - Indicator Weekly Level / Change Implication for S & P 500 Implication for Nifty* S & P 500 3509, 7.32% Bullish Bullish Nifty 12264, 5.34% Neutral ** Bullis...3 years ago
-
November report "Is it True, as David Hume (1711 – 1776) postulated that, "Nothing is esteemed a more certain sign of the flourishing conditions of any nation than the lowness of interest"?" published. https://bit.ly/2y4LJZQ - November report "Is it True, as David Hume (1711 – 1776) postulated that, "Nothing is esteemed a more certain sign of the flourishing conditions of any n...3 years ago
-
Fully Automated Trend Trading w/ Stocks Or Options - There’s a lot of research to support the usage of trend indicators as simple risk reduction elements that can be layered onto an existing strategy. Howev...3 years ago
-
2020 Top Investment Picks – Q3 Update - At the beginning of the year, I put together a list of Top Investment Picks for 2020 from the investment community and track them on this website. This is ...3 years ago
-
Upside-Down Markets: Profits, Inflation and Equity Valuation in Fiscal Policy Regimes - I just published a new long-form piece through OSAM entitled “Upside-Down Markets: Profits, Inflation and Equity Valuation in Fiscal Policy Regimes.” In th...3 years ago
-
The last of 12326 - February 22nd 2012..... First post... https://permabeardoomster.blogspot.com/2012/02/can-anyone-fly-plane.html -- This post will be the last under the o...
 3 years ago
 -
-
Ultramarathoner Runs Over 200 Miles in Backyard, Wins Golden Toilet Paper Roll - Strange times indeed. In the land “BC,” before coronavirus, people ran long distances in foot races, and toilet paper wasn’t coveted. Things have changed. ...4 years ago
-
One Year Later - A year ago today I lost my father and my best friend, everyone here lost their mentor and a friend. Dad and I spent the last 7 years of his life living tog...4 years ago
-
-
Advanced Micro Devices (AMD) Retreating Towards Key Support Around $25.60-$27 -
AMD has failed to clear the 2018 high around $34.20. It is retreating, and has broken an August/September sup...
4 years ago -
Advanced Search is Now on Stocktwits - Advanced Search Is Now on Stocktwits Come rain or shine, the Stocktwits community shares over 200,000 messages per day. That includes charts, news, trade i...4 years ago
-
Nightly Algo Report – December 6, 2018 - To access this post, you must purchase Premium Plan or Premium Plan - Annual. The post Nightly Algo Report – December 6, 2018 appeared first on Elliottwa...5 years ago
-
Don’t be Fooled by the Pullback in the Dollar Because…. - Don’t be fooled by the pullback in the U.S. dollar today because the greenback could still strengthen further before the end of the year. Nearly all of the...5 years ago
-
A look at the bull market ahead - My latest missive on the near-term stock market outlook can be seen at Financial Sense web site. You can see it by clicking on the following link: https:/...6 years ago
-
Weekly Videos - This week’s video will be posted on the new home for Short Takes. If all goes well, it will appear sometime between 6:00 and 8:00 pm ET.6 years ago
-
Gold Miners near a buy zone - Gold cleared a several month long consolidation a few weeks ago as it cleared $1300, and has since been consolidating as it drifts back to […] The post G...6 years ago
-
Current Account Deficits and Safe Assets - The International Monetary Fund has issued its External Sector Report for 2017, and among its key findings: “Global current account imbalances were broadly...6 years ago
-
Kafka For The Twenty First Century - I've been spending a slightly frustrating day trying to update my payment details at google. To log in to my admin console I need to log in using my G Sui...
 7 years ago
 -
Gold Unleashed by Fed - Gold's next major upleg was likely unleashed by a very-dovish FOMC this week, which now has its hands tied on hiking rates or being hawkish due to the US e...7 years ago
-
August 24th Blogger Sentiment Poll - There are more bulls than bears in this week's poll. Blogger Sentiment Poll Participants: 24/7 Wall St (N) Carl Futia (+) Dash of Insight (+) Elliot Wave L...14 years ago


Forex Insight
-
Italy Business Confidence below expectations (89.5) in April: Actual (87.6) - Read more on https://www.fxstreet.com12 minutes ago
-
Chart Art: U.S. Dollar Index’s (DXY) Trend Support Zone - The U.S. dollar (DXY) dropped faster than Taylor Swift dropped an extra 15 songs! Will the downswing send DXY to a technical support zone?3 hours ago
-
US Dollar Rattled by Weak PMIs, US GDP and Core PCE Remain this Week’s Key Drivers - The dollar slipped in early US turnover as the latest S&P PMIs miss forecasts and last month’s numbers. Growth and inflation data and US Treasury auctions ...12 hours ago
-
Market Insights Podcast – BOJ, AU inflation, US PCE and US Magnificent 7 stocks earnings in the focus - OANDA Senior Market Analyst Kelvin Wong joins Jonny Hart to discuss this week’s key economic data and events. Firstly, Australia’s monthly CPI (March) out ...1 day ago
-
Don’t be Fooled by the Pullback in the Dollar Because…. - Don’t be fooled by the pullback in the U.S. dollar today because the greenback could still strengthen further before the end of the year. Nearly all of the...5 years ago
-
EUR/USD Weekly Outlook - EUR/USD's decline attempt was contained at 1.0494, above 1.0493 support and rebounded. Initial bias stays neutral this week first. On the upside, break of ...7 years ago
-
Loonie and Aussie Share Downward Bond - In yesterday’s post (Tide is Turning for the Aussie), I explained how a prevailing sense of uncertainty in the markets has manifested itself in the form of...12 years ago
India Market Insight
-
Nifty Back to Gann Angle Resistance,24 April 2024 Trade Plan - Foreign Institutional Investors (FIIs) displayed a Bearish approach in the Nifty Index Futures market by Shorting 7568 contracts worth 846 crores, resul...4 hours ago
-
Tata Elxsi Q4 net profit, revenue decline QoQ; firm declares dividend of Rs 70 per share - [image: Tata Elxsi Q4 net profit, revenue decline QoQ; firm declares dividend of Rs 70 per share] The net profit was down 4.6 percent quarter-on-quarter co...18 hours ago
-
Rupee falls 29 paise to close at 82.68 against US dollar - During the day, the rupee touched a high of 82.45 and a low of 82.68 against the greenback. On Friday, the rupee had settled at 82.39 against the dollar.
 10 months ago
 -
-
ES Hourly cloud and 4 Hour chart - - ES Hour moving towards the hourly cloud which may act as resistance. - 4 Hour chart shows a possible bullish candle which may give new high's ...
 2 years ago
 -
JUST NIFTY BLOG 10-01-2020 - Bulk Deals FII DII Stats Date # of Deals Total Volume (In Millions) 01-01-1970 0 0.00 Click here to see all Bulk Deals Date Category Buy Amount (Rs. Cror...4 years ago
-
Vist Note on Federal Bank - We recently met the senior management of Federal Bank which is one of the old private sector banks with a distribution network of 1252 branches (48% Kerala...6 years ago
-
Nifty Bulls bounces ferociously holding 9930,EOD Analysis - FII's bought 4.8 K contract of Index Future worth 262 cores ,9.7 K Long contract were added by FII's and 4.8 K Short contracts were added by FII's. Net Ope...6 years ago
-
Midcap & Smallcap Index Corrects, Lets Come Back To Fundamentals Again - Midcap Index had made a high of 18511 on 16th May 2017, fell almost 7% and is currently trading at 17230. Smallcap Index made all time high of 7679 on 11th...6 years ago
-
Market outlook for 30/10/2016 - *Nifty closed up 22.75 points (0.26%) at 8638.00* while Future closed at 8667.40, premium of 29.40 points. *Bank Nifty closed up 41.35 points (0.21%) at 19...
 7 years ago
 -
Option Open Interest for 28-10-2016 - Inference The index opened flat to positive and after making an initial low around 8581 saw some short covering to close at 8638.00, gain of 22.75 points. ...
 7 years ago
 -
Market Review for 23rd August 2016 - *Nifty (8629)* we said ‘technically trend is still intact but there exists selling pressure near 8746 and support around 8600 zones’ the Nifty unfolded as...7 years ago
-
ITC To Resume Cigarette Manufacturing - ITC manufactures a range of cigarette brands, including India Kings, Classic, Gold Flake, Navy Cut, Capstan, Bristol, Flake, Silk Cut, which are manufactur...8 years ago
-